1. Cover
2. Sponsors

Sponsoring this book would cost $6000 a year. Your logo will be put in sponsor section and it will be linked to your website. To sponsor this book contact mindaslab@protonmail.com
3. Contribute
I want to keep this book as reader driven as possible. The reader may chat about this book here https://gitter.im/Data-Science-and-Artificial-Intelligence-Book/community like asking doubts and suggestions. Or email me here mindaslab@protonmail.com or talk about it in telegram in Data Science and Artificial Intelligence group here https://t.me/ds_ai.
4. Copyrights
This book, all sections excluding the sponsor section is released under GFDL https://www.gnu.org/licenses/fdl-1.3.html
5. Getting this book
You can get this entire book here https://data-science-and-artificial-intelligence.gitlab.io/. To get the code in this book as well as the book source, you can click here https://is.gd/dsaibook.
6. Who is this book for?
I am a practical guy, one who likes to do things and see output for myself. So if you are looking for a practical Data Science and Artificial Intelligence book, then this is for you.
Experimentation and trying out things is important, but it should not be blind and should have a good educational and knowledge background. Imagine a blindfolded person with a machine gun, he will use up lot of bullets before hitting the target. We want to be a efficient sniper, so this book with cover lot of theory as well.
This book is not for one who wants to read it and start an immediate career in Data Science or looking for a job with higher pay. This is for people who wish to fall in love with Statics and Computers.
7. What is Data Science?
We have a lot of data today. Go to Twitter, Reddit or any other social network, there is so much data that you could scroll on for the entire year. There is so much literature produced every year that it takes many lifetimes to read it. People are producing lot of data like their blogs, books, micro blogs, vlogs, mlogs and so on that we are able to apply statistical methods on them to obtain some insights.
We shop, all our shopping data is stored, some shops are able to predict you are pregnant or not,[1] have you ever wondered how Google gave you the right article to read? Gave you the right search result? Showed the right you tube video? Well Google knows who you are, who your contacts are because you use an Android phone, it knows what you send in mail, what videos you watch, your friends watch and so on, with such a lot of information its able to find out about you and make predictions about what you want next.
There is so much information we generate even without knowing us, and all these information is very cheap to store today, and you have enough computing power to crunch them, the science of studying and data could be called as data science.
There is also another simpler definition I buy into, Data Science is nothing but doing analysis on Data with Computer Science. That’s it. Weather you romanticize it or not, these are the definition.
8. You are a data scientist
You too are a Data scientist whether you realize it or not. Take a look at the graph below, you have got two bunch of data points. The one is crowded near top left which indicates that these people have spent a lot on cosmetics.
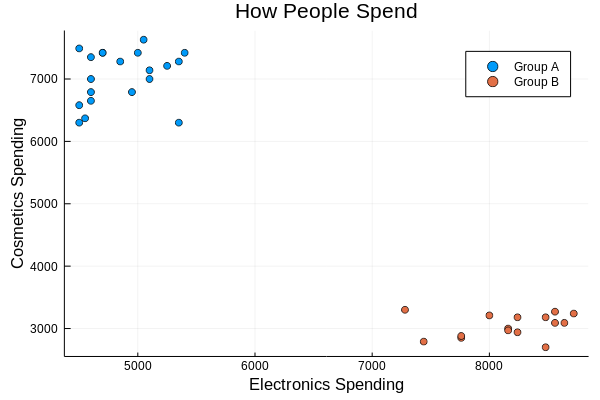
Look at the points crowded at the bottom right, these indicate higher spending on Electronics than on cosmetics. Now out of these two groups which one do you think are female? Clearly you would say one at the top left who have higher spending on cosmetics. Well then, how do you know?
For your entire life you have been observing and gathering data about men and women, you know who spends on what more, with these data you were able to form an algorithm in mind, and plugging these new set of data points to the algorithm you were able to tell which group of points corresponds to spending pattern of man or a woman.
9. What is Artificial Intelligence?
Lets say that you want hot water, you heat a pint of water over the stove, you keep checking if the water boils, when it does so you know that the water is hot, you switch off the stove and make use of the water. This is natural intelligence. Imagine you purchase a electronic water boiler, it has a sensor thermocouple[2] that is tuned to cut off just before the water boil, rather than you checking the water temperature, this machine has an intelligence of its own which maintains near boiling temperature. Now does this machine have intelligence?
Now we would say it no. But sometime back we branded these machines as intelligent devices. And I do believe these machines have intelligence. This intelligence is not natural, its not because this machine has a bunch of neurons like us, instead the intelligence to this machine was painstakingly imparted to it by humans, hence its an artificial intelligent system.
Today’s artificial intelligence systems however is expected to improve. If you do not like certain Youtube videos and skip it, Google learns from it, the next time Youtube gives you better videos. The system slowly learns to be better and better from its experience.
Experience of an Artificial Intelligence system is nothing but the data that’s fed to it. You feed data to it, and it spits out an algorithm. When you give data to the algorithm, it spits out the prediction. Let’s see it more in detail.
9.1. Training and Testing
Let’s say that you want to predict rent of a house, you interact with different real estate people, house owners, you ask them about the area of the house, what features it has, possibly how many car parks, does the house have a garden? What is the quality of ground water? Does it have a government water connection? How many parks are there in 1Km radius? And so on. You tabulate it and you write matching rent of the house. Now you takes the features of the house as inputs and the rents as the outputs, now look at the diagram below
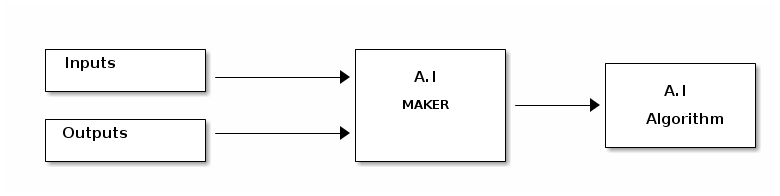
You feed these inputs and outputs to a magical A.I MAKER, this is some magical thing that when fed with inputs and outputs generates an A.I algorithm that can predict things. Now this A.I maker will do something and spit out an A.I algorithm. This is called as the Training Phase in A.I.
Now to check how good the A.I algorithm is, you give it sme inputs and it gives some predictions as shown below
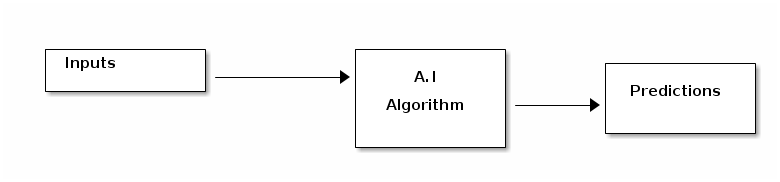
Now you will have some expected outputs for the input, you compare it with the predictions that the A.I algorithm made as show below
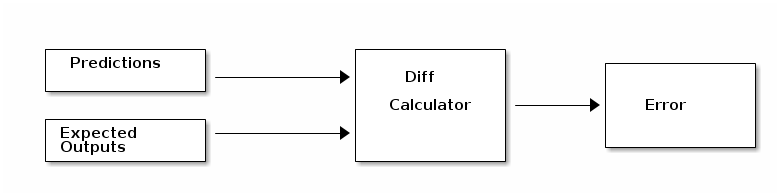
This gives an error report, that is you know how much better and how much worst this algorithm is performing. As an A.I engineer, your job is to reduce the error.
9.2. Feature Engineering
You will give some inputs like the area of the house, its frontage, number of car parks, the road width etc as features to the A.I maker that creates an A.I algorithm, but would you give feature like the height of the house owner? Number of crows you spotted while traveling to house? No! No way. This might bring an laughter or smile, because we all live in a house and most of us know what it means to own a house, or to rent it. But in many domains you may not be aware what are the features you need to feed into A.I MAKER for it to give out the right prediction algorithm. Hence in most cases while designing an A.I algorithm, understanding the domain, selecting what features or attributes that needs to go into the A.I algorithm becomes very important. Perhaps it might be better to consult and/or work with Domain Knowledge Expert.
Selecting the right features to be given to the A.I maker in order to create the best A.I Algorithm is called Feature Engineering. A good feature engineering will produce an algorithm that will give very less error and deviation for a broad set of inputs.
9.3. Splitting Testing and Training sets
It is wise to split the data that we pass to the A.I Maker into two. One is called a training set, which is used to make the A.I Algorithm, other is called a testing set with which we will judge how good the algorithm is. This is because if we give the same data for testing and training, we will never know whether the algorithm has learned and has generalized and understood the situation, or it has just remembered things.
It’s like this, I teach you to multiply by showing how to multiply \$56 xx 32\$ and then ask you what \$56 xx 32\$ is, most probably you will tell it from the memory, so to check your understanding I better ask something else like whats \$42 xx 84\$.
Remembering things though in humans may be considered intelligence, in a computer it’s not. You don’t think a dictionary app as being more intelligent than a calculator app, though a dictionary app has lot of data. A calculator app has almost no data but knows how to find answers to your questions.
9.4. Over Fitting
Let’s say that you want to create a machine learning algorithm for predicting housing prices, so you gather prce of house and its area and plot it as shown.
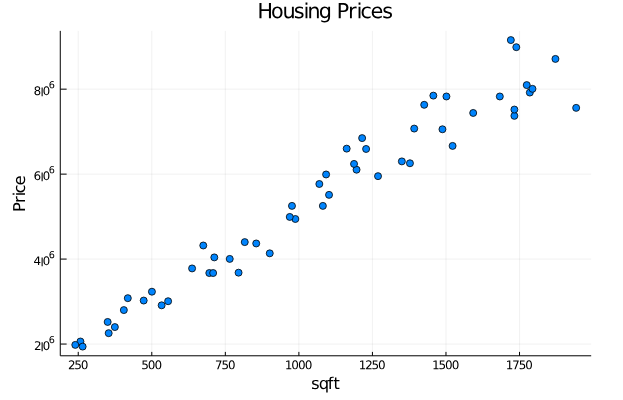
Looking from the data there seems to be a correlation between the size of the house and it’s price. If I train a model on this data and model says this is how the prices changes in accordance with the area as shown below
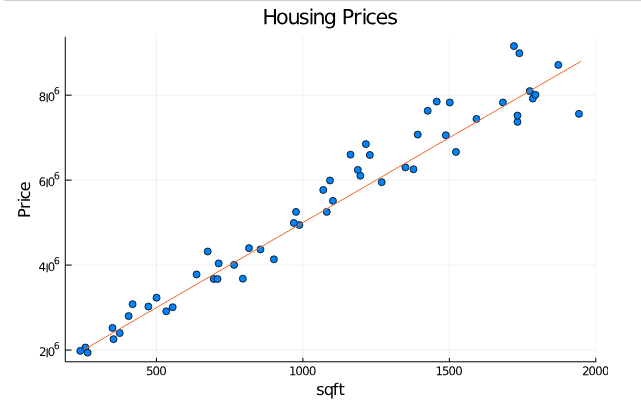
then I would think that the model has generalized well, but if the model shows something complex as shown below, where it’s able to predict perfectly about the trained data
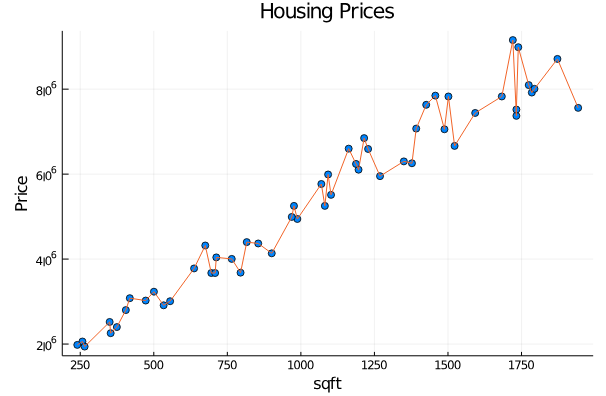
I would be really suspicious. Artificial Intelligence is about generalization, finding a general rule, like a ball park rather than just remembering or just going too tight with the trained data.
When you are practicing A.I and when you see a model that firs data perfectly, you must be a bit suspicious.
10. What you need to know?
10.1. Mathematics
You need to be strong in Mathematics to be a data scientist. I would say that one needs to know math well to be a computer programmer. There are people who say you could become a data scientist without knowing math, that’s bullshit. It’s like saying that you can go from Chennai to Sydney by walking, just because you are able to walk to your nearby friends home. To go from Chennai to Sydney, you need to learn to pilot a aircraft, that would be difficult, but if your dreams are higher, you need to have sufficient knowledge to achieve it. Similarly, if you want to be an amateur Data Scientist, you can ignore mathematics, but if you want to be a professional one, you must master it. So strengthen up your math skill. The best place to learn math I would say is https://kanacademy.com. There are also other great places which might be added to this book as I feel necessary.
10.2. GNU/Linux
GNU[3] is a project that aims to liberate you from the Satans called Apple, Microsoft and other proprietary software. To know more about their noble philosophy go here https://fsf.org. To liberate you they have created many tools without which modern computing would be impossible. The aim of GNU is to develop a full fledged operating system to liberate you. Linux a kernel[4] had the great honor of being chosen as a part of GNU operating system.
Since GNU/Linux is a truly free software, many of them have created their own distributions or flavours. Some of them completely respect your freedom like the ones here https://www.gnu.org/distros/free-distros.html, others still manage to shackle you.
Today most Data Scientist use Debian https://www.debian.org/ or Ubuntu http://ubuntu.com GNU/Linux, though they shackle you, I feel it would be a great starting point if you have no idea about free software. Try finding about them from your local GNU/Linux user groups https://en.wikipedia.org/wiki/Linux_user_group. Socialize and make the community grow.
Once you have got GNU/Linux installed on your computer, visit https://linuxjourney.com/ to learn it. And do learn it well before proceeding further.
10.3. Programming
You need to know programming. In this book we will teach you about Julia programming https://julialang.org. There are Julia resources out there, look into the section Julia.
Julia
11. Why Julia?
I should be writing a text about why Julia is needed when so many programming languages are there, but I think this video explains it and its precise and won’t cost your time much
12. Installing Julia
Installing Julia as simple for me. I use GNU/Linux, I highly recommend you too use it. Visit Julia downloads page here https://julialang.org/downloads/, you will be shown something like this
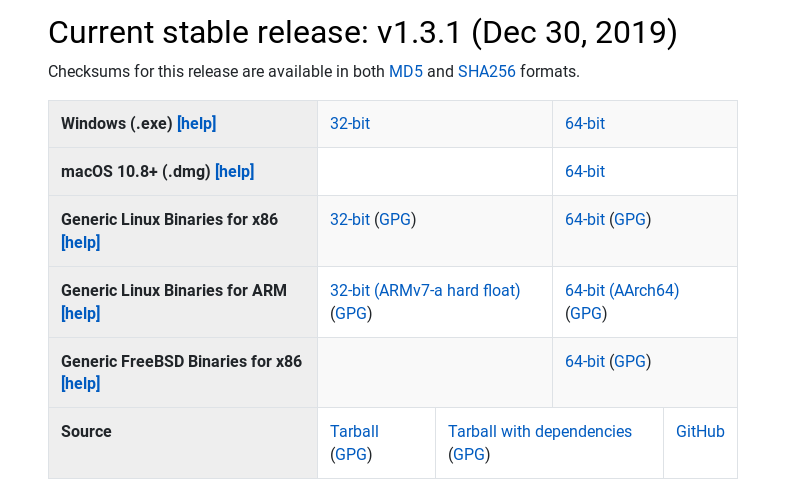
Select installation for your OS. For GNU/Linux I downloaded the binaries and unzipped the file into my home folder. In ~/.bashrc I pasted these lines
# Add Julia to PATH
export PATH="$PATH:$HOME/julia-1.3.1/bin"
the in terminal I reloaded .bashrc using this command:
$ source ~/.bashrc
Now when I typed julia in terminal, I got a nice Julia prompt as shown
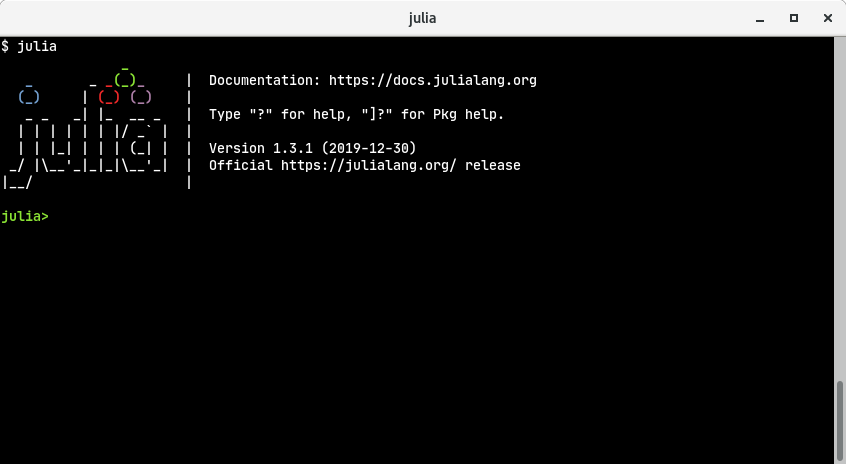
To exit julia, all you need to do is to hit Ctrl+D
13. Getting Help
Julia has a vibrant and enthusiastic community of volunteers and a forum to assist you. You can ask your doubts here https://discourse.julialang.org/ , and help others who need help.
14. REPL and Jupyter notebook
14.1. REPL
You can use Julia in many ways, for very short one liners, REPL[5] is enough. To use the repl, launch your terminal and type in julia, you should be getting a beautiful Julia console as shown
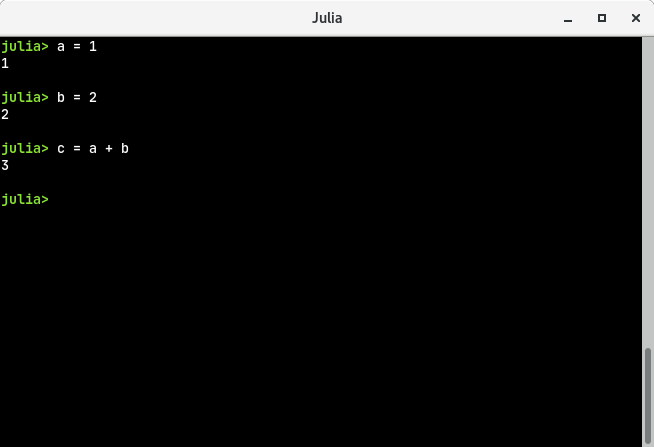
Now let’s try in some math
julia> a = 1
1

julia> b = 2
2

julia> c = a + b
3
You will be getting an output as shown below
14.2. Jupyter Notebook
REPL is a good way to check out short snippets, but if you are developing some algorithms, you need to run something little more bigger and see its output in a much nicer form. There is this thing called Jupyter notebook, which takes your Julia code, runs it and puts out an output and it’s done in a web-browser so that things look ore pleasing and it’s easier to operate.
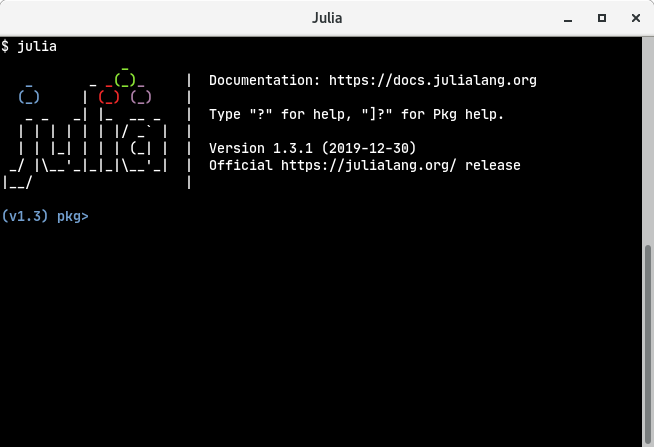
Now let’s see hot to get this Jupter notebook up and running. First type julia in your terminal to get Julia REPL as shown
Now press ], when you do that, the Julia console will go into the package mode. That is you will be able to install Julia packages, it must look something like this
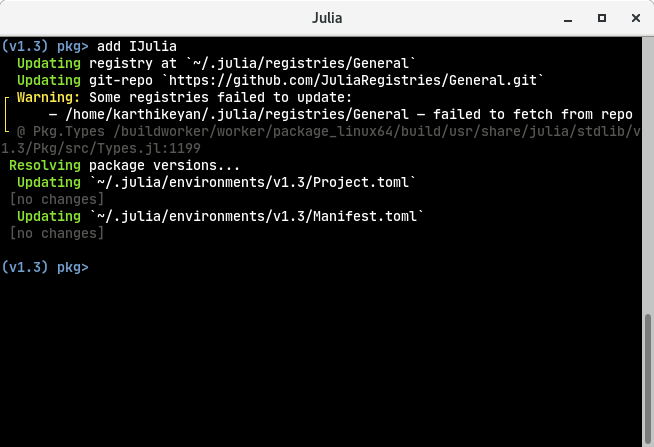
Now type in this:
pkg> add IJuliaThis will add IJulia, the thing that’s needed for notebook
|
Note
|
Don’t worry if you don’t understand much or anything, as you practice and you learn more you will get. For now if it works, it’s all good. |
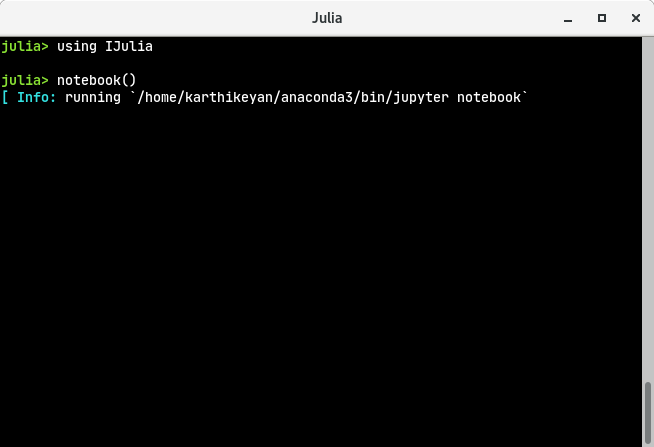
Now you have installed I Jula, press BACKSPACE to come out of pkg> and back into julia> and now do this:
julia> using IJulia

julia> notebook()
Something like this will happen
And this will show up in browser
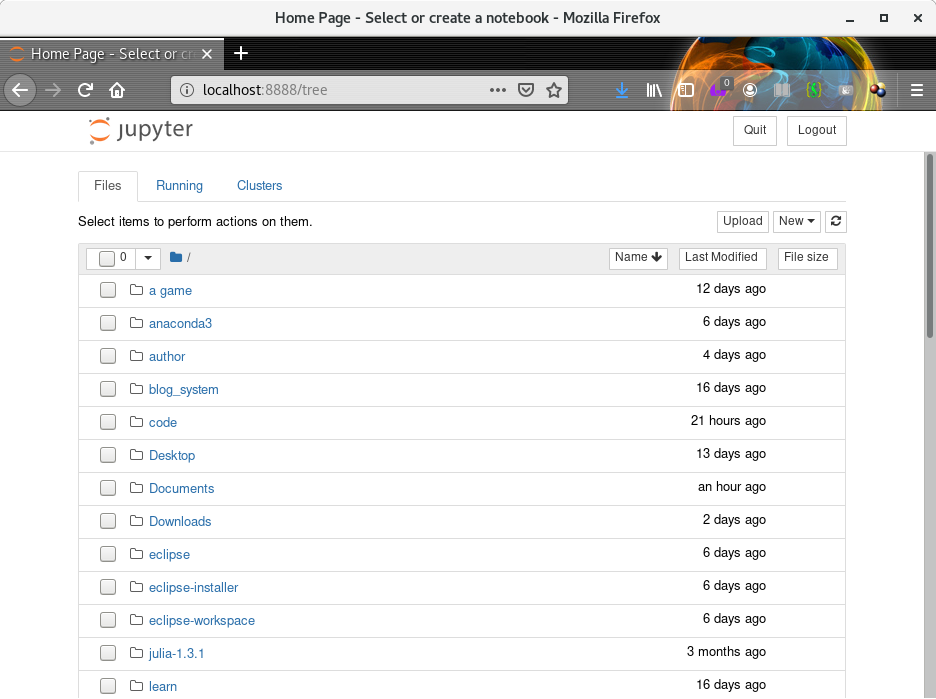
Now if you at top right you will see a button named NEW. Click it and select your language (I use Julia 1.4 now)
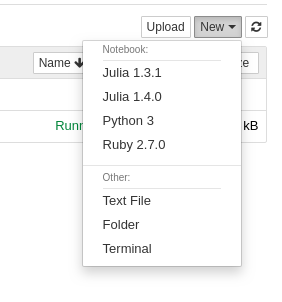
You will see a new notebook as shown
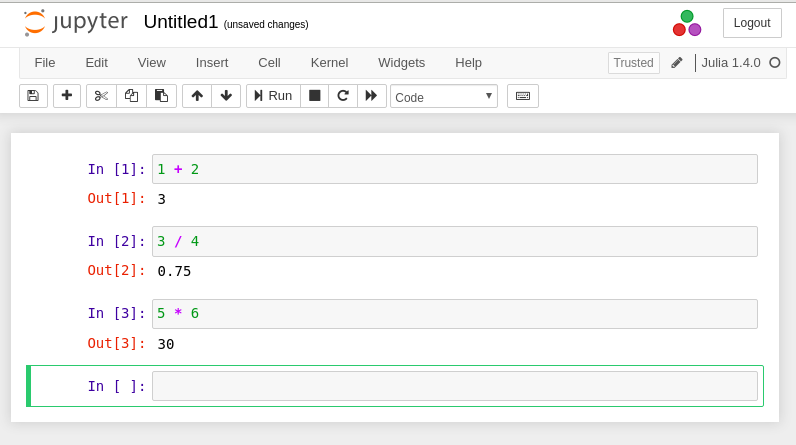
In those cells that start with In []:, enter any julia expression and press Shift+Enter to evaluate.
15. Leaning Julia
First I thought of writing my own Julia tutorial, then it would consume lot of effort and it would be like reinventing the wheel[6]. There are good Julia resources available out there, so please check them out to learn Julia. Notables ones are
-
Think Julia https://benlauwens.github.io/ThinkJulia.jl/latest/book.html
-
Introducing Julia https://en.wikibooks.org/wiki/Introducing_Julia
-
Julia Docs https://docs.julialang.org/
Visualization
16. Julia Plots
There is a package called Plots[7] in Julia that will help you with creating graphs and visualizations. Let’s see about it.
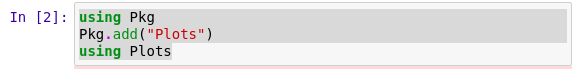
To get started you first need to install it, fire up your notebook, and in it type this in the first cell
16.1. Types of plots
using Pkg
Pkg.add("Plots")
using Plots
and press SHIFT+ENTER. If you are lucky before A.D 3000, the necessary stuff would have been installed and your plotting library would be ready for use.
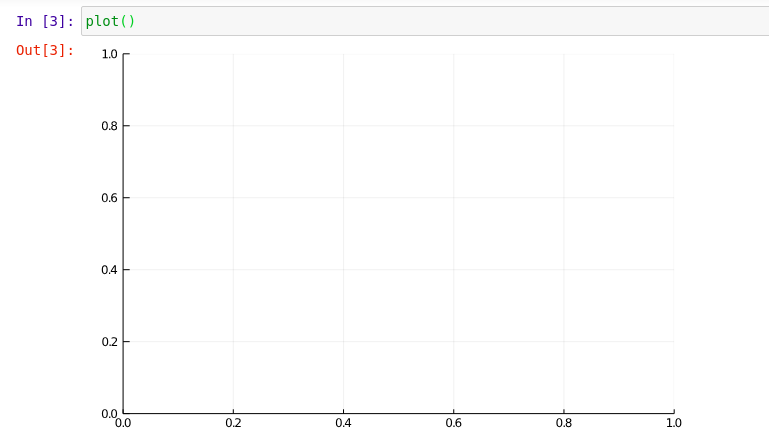
Next let’s generate an empty plot. Type the following in the next call
plot()and press SHIFT+ENTER, you will be seeing an empty plot as shown below.
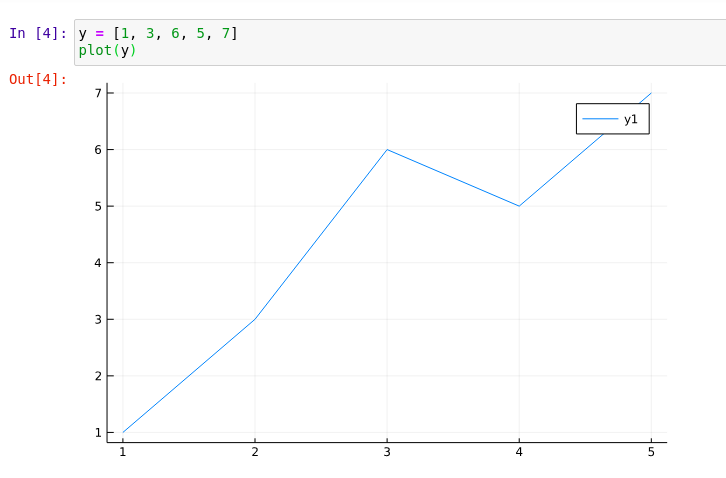
Now let’s start by plotting some values, type the code below and execute it
y = [1, 3, 6, 5, 7]
plot(y)
as you can see below the values are plotted in y-axis, if nothing is given, x-axis is assumed to be 1, 2, 3, 4 and so on.
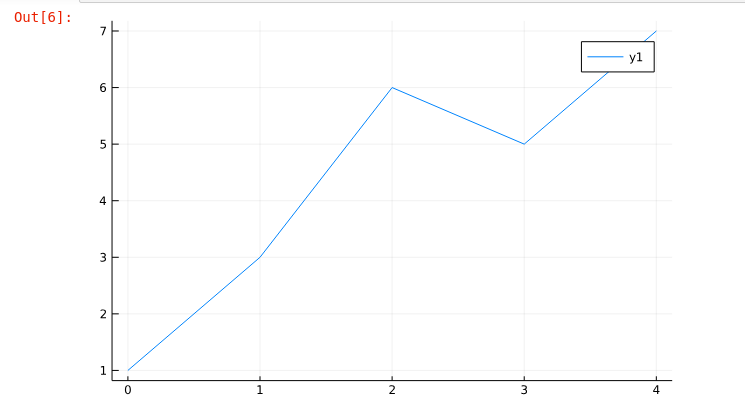
Now a graph is usually a plot on a x-y plane, so lets plot with some x and y values, type in the code below and execute the cell
x = [0, 1, 2, 3, 4]
y = [1, 3, 6, 5, 7]
plot(x, y)
as you can see, you will get kinda same plot as above, but in the x-axis it starts from 0 since we have given x = [0, 1, 2, 3, 4]
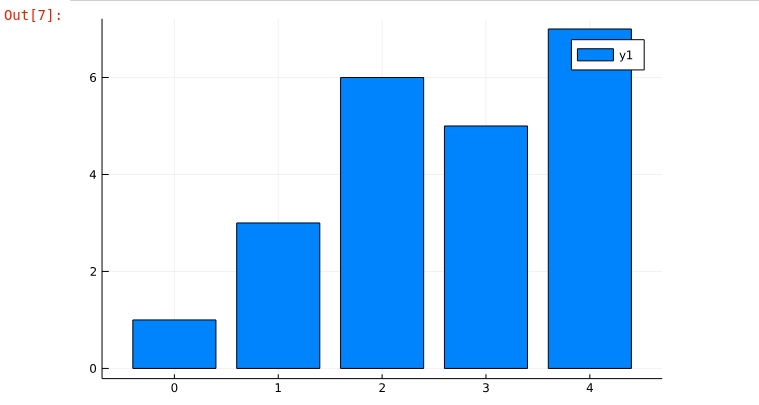
Now let’s see how to plot a bar chart, rather than use plot() tht usually plots a line, we use the bar() function as shown
x = [0, 1, 2, 3, 4]
y = [1, 3, 6, 5, 7]
bar(x, y)
The above code generates a beautiful bar chart as shown below.
Like bar we can have a pie chart too, as shown
x = ["Ten", "Twenty", "Thirty", "Forty"]
y = [10, 20, 30, 40]
pie(x, y)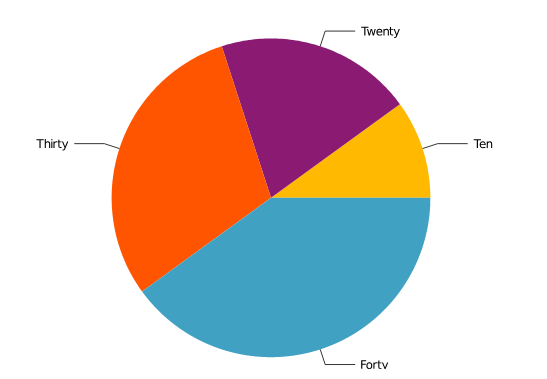
Scatter plot is one the thing which I use a lot for data science and it’s accomplished by the function scatter() as shown below
x = [0, 1, 2, 3, 4, 1, 3, 6, 5, 7]
y = [1, 3, 6, 5, 7, 0, 1, 2, 3, 4]
scatter(x, y)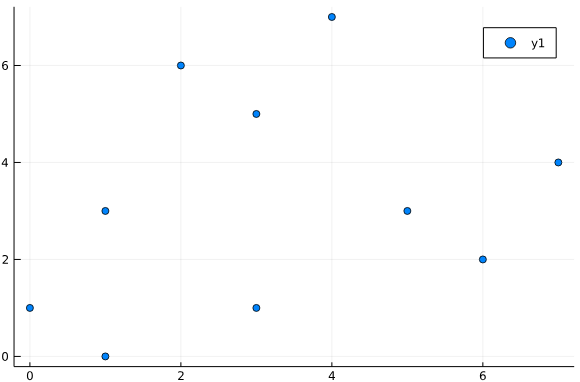
Next are the histograms, if you want to see if values are concentrated around something you can use it. In the code below we call a histogam() function to which we pass an array of numbers and this function is intelligent enough to plot it out
histogram([0, 1, 1, 5, 5, 5, 5, 7, 9, 0, 7, 3, 4, 11], bins = 5)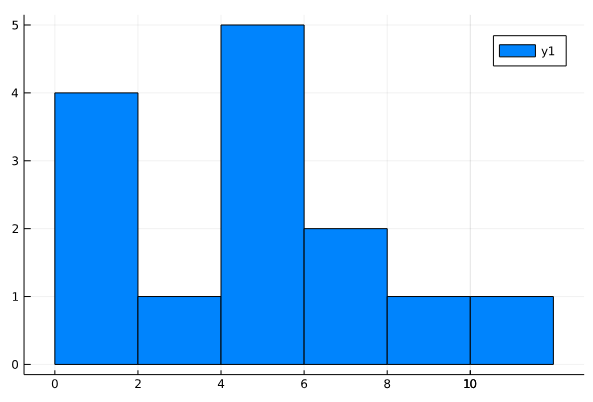
If you want to see where the numbers are clustered around, then you can use these plots.
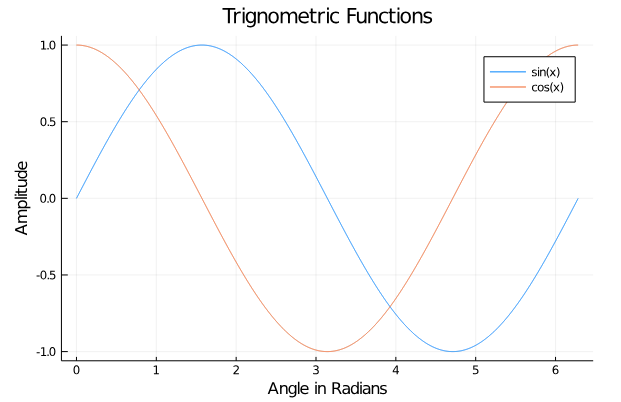
16.2. Documenting Plots
using Plots

x = (0:0.001:2π)
sinx = [sin(val) for val in x]
cosx = [cos(val) for val in x]

plot(
    x, [sinx, cosx],
    title = "Trignometric Functions",
    xlabel = "Angle in Radians",
    ylabel = "Amplitude",
    labels = ["sin(x)" "cos(x)"]
)
17. Great Data Visualizations

17.2. 1854 Broad Street cholera outbreak

17.3. Hans Rosling’s Visualization
18. A stub section
Machine Learning Algorithms
19. Regression Vs Classification
20. Linear Regression
21. Polynomial Regression
22. KNN Classifier
23. Decision Trees
24. Random Forrest
25. Support Vector Machines
26. Neural Networks
Projects
27. The Iris Project
28. Surviving Titanic
Appendix - Mathematical Resources
29. Mathematical Foundations
-
Introduction to Logic, Stanford (https://www.coursera.org/learn/logic-introduction)
-
Introduction to Mathematical Thinking, Stanford (https://www.coursera.org/learn/mathematical-thinking)
-
High School Mathematics, MIT (https://ocw.mit.edu/high-school/mathematics/)
30. Algebra
-
Algebra I, Khan Academy (https://www.khanacademy.org/math/algebra)
-
Algebra II, Khan Academy (https://www.khanacademy.org/math/algebra2)
-
Linear Algebra, MIT (https://ocw.mit.edu/courses/mathematics/18-06-linear-algebra-spring-2010/)
-
Linear Algebra - Foundations to Frontiers, University of Texas at Austin (https://www.edx.org/course/linear-algebra-foundations-to-frontiers)
-
Introduction to Linear Models and Matrix Algebra, Harvard (https://www.edx.org/course/introduction-to-linear-models-and-matrix-algebra)
31. Calculus
-
Precalculus, Khan Academy (https://www.khanacademy.org/math/precalculus)
-
Calculus 1, Khan Academy (https://www.khanacademy.org/math/calculus-1)
-
Calculus 2, Khan Academy (https://www.khanacademy.org/math/calculus-2)
-
Multivariable calculus, Khan Academy (https://www.khanacademy.org/math/multivariable-calculus)
-
Differential equations, Khan Academy (https://www.khanacademy.org/math/differential-equations)
-
Introduction to Calculus, University of Sydney (https://www.coursera.org/learn/introduction-to-calculus)
32. Statistics & Probability
-
Statistics and probability, Khan Academy (https://www.khanacademy.org/math/statistics-probability)
-
Fundamentals of Statistics, MIT (https://www.edx.org/course/fundamentals-of-statistics)
-
Data Science: Probability, Harvard (https://www.edx.org/course/data-science-probability)
-
Probability - The Science of Uncertainty and Data, MIT (https://www.edx.org/course/probability-the-science-of-uncertainty-and-data)
-
Improving your statistical inferences, Eindhoven University of Technology (https://www.coursera.org/learn/statistical-inferences)
-
Introduction to Probability and Data, Duke University (https://www.coursera.org/learn/probability-intro)
-
Probability Theory and Mathematical Statistics, Penn State (https://online.stat.psu.edu/stat414/)
33. Data Science & Machine Learning
-
Data Science Math Skills, Duke University (https://www.coursera.org/learn/datasciencemathskills)
-
Essential Math for Machine Learning: Python Edition, Microsoft (https://www.edx.org/course/essential-math-for-machine-learning-python-editi-2)
-
Mathematics for Machine Learning, Imperial College London (https://www.coursera.org/specializations/mathematics-machine-learning)